Your CRM holds more answers than you think. Every contact record, deal update, email open, and closed-won opportunity tells a story about how your business is performing — and where it could perform better. The problem is that most small businesses collect all of this data and then never look at it in a structured way.
CRM reporting and analytics is the practice of turning the raw information inside your CRM into reports, dashboards, and insights that drive real business decisions. When done well, it replaces gut feelings with evidence, surfaces problems before they become costly, and shows you exactly where to focus your limited time and budget.
This guide covers the essential reports every business should be running, the key metrics that actually matter, how to build dashboards that your team will use, and the reporting mistakes that quietly cost you revenue.
Why CRM Reporting Matters
A CRM without reporting is a filing cabinet. It stores information, but it does not help you act on it. Reporting is what bridges the gap between data collection and decision-making.
Here is what changes when you start using your CRM reports consistently:
- You see problems early. A drop in lead conversion rate shows up in a report weeks before it shows up in your bank account. Reporting gives you time to course-correct.
- You allocate resources better. When you know which lead sources produce the highest-value customers, you stop spending money on the ones that do not.
- You hold your team accountable. Activity reports make it clear who is following up and who is not — no opinions, just data.
- You forecast with confidence. Revenue projections built on actual pipeline data are far more reliable than guesses based on last quarter.
If you are still building the case for CRM adoption in general, our overview of why businesses use CRM covers the broader value proposition. Reporting is one of the most compelling reasons on that list.
Essential CRM Reports Every Business Needs
You do not need dozens of reports. You need the right six or seven, reviewed consistently. Here are the reports that give small and mid-sized businesses the clearest picture of their performance.
Sales Pipeline Report
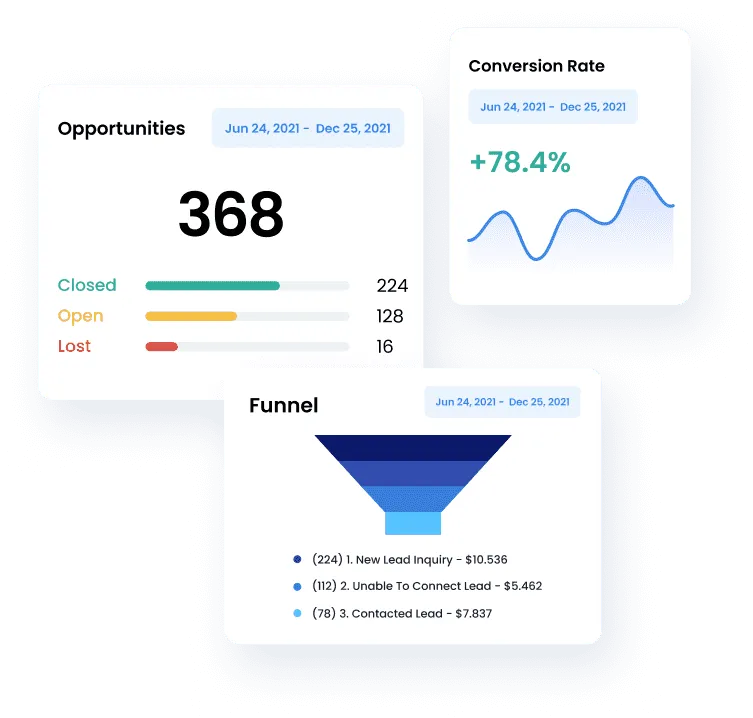
The pipeline report shows every active deal, organized by stage, with values attached. It answers the fundamental question: how much potential revenue is in play right now, and where is it sitting?
A healthy pipeline has deals distributed across all stages. If everything is clustered in the early stages, your team may be struggling to advance conversations. If deals are piling up near the close, something is stalling the final decision.
For a deeper look at how to structure and manage your pipeline, see our guide on CRM and sales pipeline management.
Lead Source Report
This report breaks down where your leads are coming from — organic search, paid ads, referrals, social media, events, direct outreach — and how each source performs through the funnel. It is not enough to know which channel generates the most leads. You need to know which channel generates the most customers.
A lead source that produces 200 inquiries per month but converts at 1% is far less valuable than one that produces 30 inquiries but converts at 15%. This report makes that distinction visible.
Conversion Rate Report
Conversion rate reports track the percentage of leads that move from one stage to the next. Where are prospects dropping off? Is the bottleneck at initial qualification, proposal delivery, or closing?
Stage-by-stage conversion data reveals exactly where your process breaks down. If you are converting leads to meetings at a high rate but losing them between proposal and close, the issue is likely pricing, objection handling, or follow-up timing — not lead quality.
For more on evaluating lead quality itself, our lead scoring guide covers how to separate your best prospects from the rest.
Revenue Forecast Report
Forecasting takes your pipeline data and projects expected revenue over a future time period — typically 30, 60, and 90 days. Each deal’s value is weighted by its stage probability. A $10,000 deal at the proposal stage (say, 50% probability) contributes $5,000 to the forecast.
Accurate forecasting depends on two things: keeping deal stages up to date and assigning realistic probabilities to each stage. If your team moves deals to “negotiation” before a real conversation has happened, your forecasts will be inflated and unreliable.
Activity Report
Activity reports measure the inputs — calls made, emails sent, meetings booked, tasks completed — that drive the outputs you care about. They answer the question: is my team doing enough of the right activities?
The value of activity reporting is not micromanagement. It is pattern recognition. When a rep is consistently hitting their activity targets but not closing deals, the issue is likely skills or messaging, not effort. When activity drops, you know to investigate before the pipeline dries up.
Customer Lifetime Value Report
Customer lifetime value (CLV) measures the total revenue a customer generates over their entire relationship with your business. This report helps you understand which customer segments are most profitable, which acquisition channels produce the highest-value customers, and how much you can afford to spend acquiring new ones.
CLV reporting also surfaces retention issues. If lifetime values are declining, it usually means customers are churning faster or purchasing less over time — both problems you want to catch early. For more on using your CRM to understand customers at this level, see our post on mastering CRM customer insights.
Key Metrics and KPIs to Track
Reports are only useful if you know what to measure. The following table covers the KPIs that matter most for small and mid-sized businesses running a CRM.
| Metric | What It Measures | Target Benchmark | How to Improve |
|---|---|---|---|
| Lead conversion rate | % of leads that become customers | 2-5% (varies by industry) | Improve lead qualification, tighten targeting, follow up faster |
| Sales cycle length | Average days from first contact to close | 14-90 days (depends on deal size) | Remove pipeline bottlenecks, automate follow-ups, pre-qualify leads |
| Win rate | % of proposals/opportunities that close | 20-30% for new business | Better discovery calls, stronger proposals, competitive positioning |
| Average deal size | Mean revenue per closed deal | Baseline against your historical data | Upsell/cross-sell, target higher-value segments, bundle services |
| Pipeline velocity | Speed at which deals move through stages | Faster is better; track trend over time | Shorten each stage, reduce stalls, automate stage transitions |
| Customer acquisition cost (CAC) | Total sales and marketing cost per new customer | Should be less than 1/3 of CLV | Optimize ad spend, improve conversion rates, leverage referrals |
| Customer lifetime value (CLV) | Total revenue from a customer over their lifetime | 3x or more of CAC | Improve retention, increase purchase frequency, reduce churn |
| Activity-to-close ratio | Number of activities (calls, emails) per closed deal | Track your own baseline and improve | Focus activities on high-scored leads, improve messaging |
| Lead response time | Time between lead creation and first outreach | Under 5 minutes for inbound leads | Automate notifications, use round-robin assignment, set SLA alerts |
| Churn rate | % of customers lost in a given period | Under 5% monthly for most SMBs | Proactive check-ins, satisfaction surveys, faster support response |
Do not try to track everything at once. Start with three to five metrics that align with your current business goals. Once those are dialed in, add more.
Building Effective CRM Dashboards
A report that nobody looks at is worthless. Dashboards solve this by putting your most important metrics in front of your team every day, updated in real time, without requiring anyone to run a manual query.
Start With One Dashboard Per Role
Different roles need different views:
- Sales reps need to see their personal pipeline, upcoming tasks, and activity targets for the week.
- Sales managers need team-wide pipeline value, conversion rates by rep, and forecast data.
- Business owners need top-level revenue metrics, lead source ROI, and trend lines over time.
Building separate dashboards for each audience keeps them focused. A dashboard that tries to show everything to everyone ends up being useful to nobody.
Follow the Three-Second Rule
If someone cannot glance at your dashboard and understand the headline numbers within three seconds, it is too cluttered. Lead with the two or three numbers that matter most — total pipeline value, monthly revenue, conversion rate — and push the detail into secondary views.
Use Visuals That Match the Data
Not everything needs to be a bar chart. Pipelines are best shown as funnels or kanban boards. Trends need line charts. Comparisons need side-by-side bars. Single KPIs are clearest as large number cards with directional arrows showing whether they are up or down.
Set a Review Cadence
Dashboards work when they become a habit. Set a standing meeting — weekly for sales teams, monthly for leadership — where the dashboard is the agenda. Review the numbers, identify what changed, decide what to do about it. The dashboard is not the end product; the decisions it drives are.
Common CRM Reporting Mistakes
Even businesses that invest in CRM reporting often undermine their own efforts with avoidable errors. Watch for these.
Tracking Too Many Metrics
More data does not mean better decisions. When your dashboard has 30 widgets, nothing stands out. Narrow your focus to the metrics that directly connect to your goals. You can always explore deeper data when a specific question arises.
Dirty Data
Reports are only as accurate as the data behind them. If your team is inconsistent about logging activities, updating deal stages, or entering lead source information, your reports will reflect that inconsistency. Establish clear data entry standards and enforce them. A CRM with clean data in five fields beats one with sloppy data in fifty.
Measuring Activity Without Outcomes
Activity reports are valuable, but not in isolation. Making 50 calls a day means nothing if none of them lead to meetings. Always pair activity metrics with outcome metrics so you can see whether the effort is producing results.
Reporting Without Acting
The most common mistake of all: reviewing reports, nodding along, and then changing nothing. Every reporting review should end with at least one action item. If conversion rates dropped, assign someone to investigate. If a lead source underperformed, adjust the budget. Reports exist to trigger decisions, not to fill a meeting.
Ignoring Trends in Favor of Snapshots
A single data point is not a trend. Pipeline value being down this week might mean nothing — or it might be the start of a three-month decline. Always look at your numbers over time. Monthly and quarterly trendlines reveal patterns that weekly snapshots miss.
How SMBcrm Helps You Report Smarter
SMBcrm’s built-in reporting dashboard gives you real-time visibility into your sales pipeline, marketing performance, and customer data — all in one place. You can track lead sources, monitor deal progress through customizable pipeline stages, and view conversion metrics without switching between tools or exporting spreadsheets.
The platform includes drag-and-drop dashboard building, so you can set up role-specific views in minutes. Automated reports can be scheduled to land in your inbox on a cadence that fits your workflow, and every metric updates in real time as your team works.
If reporting and analytics are a priority in your CRM decision — and they should be — our CRM buyer’s guide walks through how to evaluate platforms on this and every other critical capability.
Turning Reports Into Action
Data without action is just noise. Here is a simple framework for making sure your CRM reports actually change how your business operates.
- Review regularly. Set a fixed schedule — weekly for sales metrics, monthly for marketing ROI and customer metrics. Do not let reporting become an occasional activity.
- Identify the signal. In each review, find the one or two numbers that changed most significantly. Not everything needs attention every week. Focus on what moved.
- Ask why. A number by itself is not an insight. A conversion rate dropping from 4% to 2.5% is a signal. Understanding that it happened because lead response time slipped from two minutes to two hours is the insight.
- Assign an owner. Every action item from a reporting review should have a name attached and a deadline. “We should look into this” is not a plan.
- Close the loop. After making a change, track whether it had the intended effect. Did response time improve? Did conversion rate recover? This feedback loop is what turns reporting from a passive exercise into a growth engine.
Frequently Asked Questions
How often should I review CRM reports?
Sales-related reports — pipeline, activity, conversion rates — should be reviewed weekly. Broader metrics like customer lifetime value, lead source ROI, and churn rate are better suited to monthly or quarterly reviews. The key is consistency: pick a cadence and stick to it so trends become visible.
What if my team is not entering data consistently?
Start by simplifying. If data entry feels like a burden, you may be asking for too much information. Reduce required fields to the essentials — deal value, stage, lead source, and next action. Then make data quality a visible part of your review process. When the team sees that reports depend on their input, compliance improves.
Do I need a dedicated analytics tool, or is CRM reporting enough?
For most small and mid-sized businesses, the reporting built into a modern CRM is more than sufficient. Dedicated business intelligence tools like Tableau or Power BI add value when you need to combine CRM data with data from other systems (ERP, finance, warehouse) at scale. Start with your CRM’s native reports and only add external tools if you hit a clear limitation.
What is the single most important CRM metric for a small business?
If you can only track one number, make it pipeline velocity — the speed at which qualified deals move through your pipeline to close. It combines deal volume, win rate, deal size, and cycle length into a single indicator of sales health. When pipeline velocity is improving, nearly everything else tends to follow.
Ready to Make Data-Driven Decisions?
SMBcrm gives you real-time dashboards, pipeline analytics, and automated reporting so your team always knows where to focus next.