Community administrators and owners can now review revenue, membership, traffic, and engagement under Settings → Analytics. The dashboard brings community reporting together within SMBcrm’s membership tools.
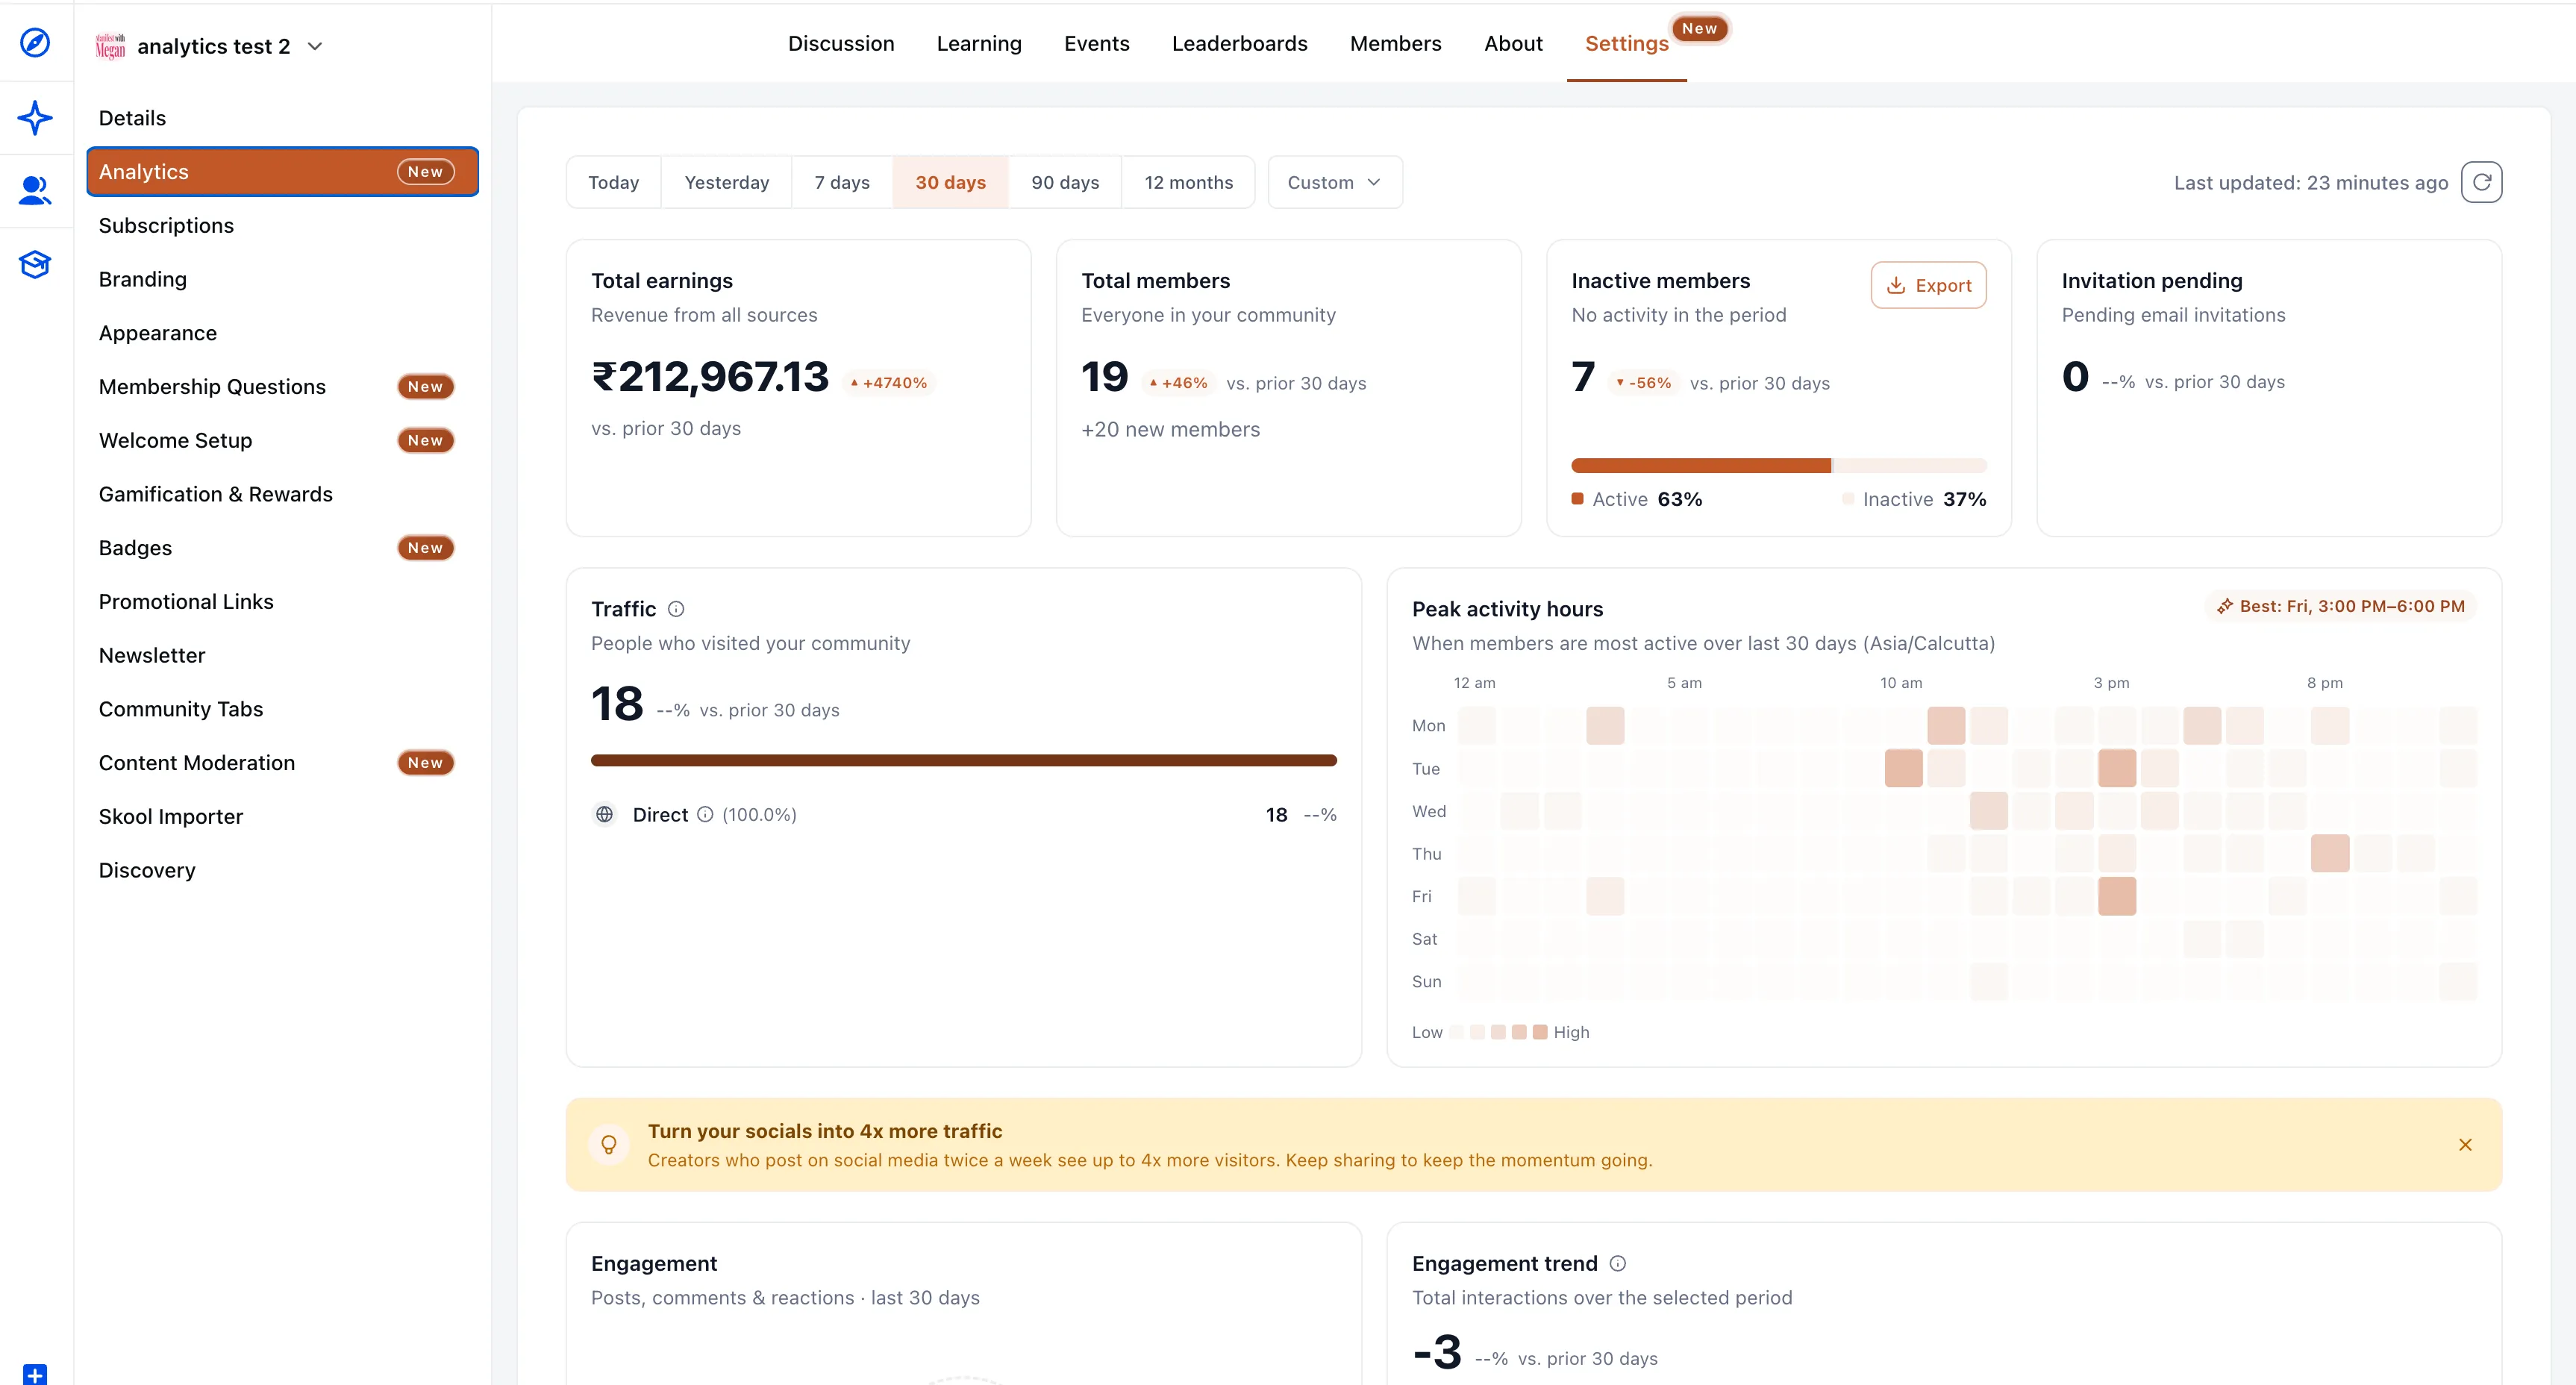
Revenue and Membership Metrics
Four headline cards summarize community performance:
- Total Earnings: Net community-attributed transaction revenue, calculated as purchases minus refunds and chargebacks, in your account’s currency.
- Total Members: Current active membership count, with new joins during the selected period shown separately.
- Inactive Members: Active members with no tracked activity during the selected period. A percentage bar shows the active versus inactive breakdown, and an Export button downloads inactive members as a CSV for follow-up.
- Invitation Pending: Outstanding email invitations that have not been cleared as of the end of the selected range.
Metrics support percentage comparisons with the previous equal-length period. When the previous period is zero, the dashboard displays N/A.
Shared Date Filters
Choose Today, Yesterday, 7 days, 30 days, 90 days, 12 months, or Custom. The default is the last 30 days, and all cards use the same selected range.
Traffic, Activity, and Engagement
Traffic Sources
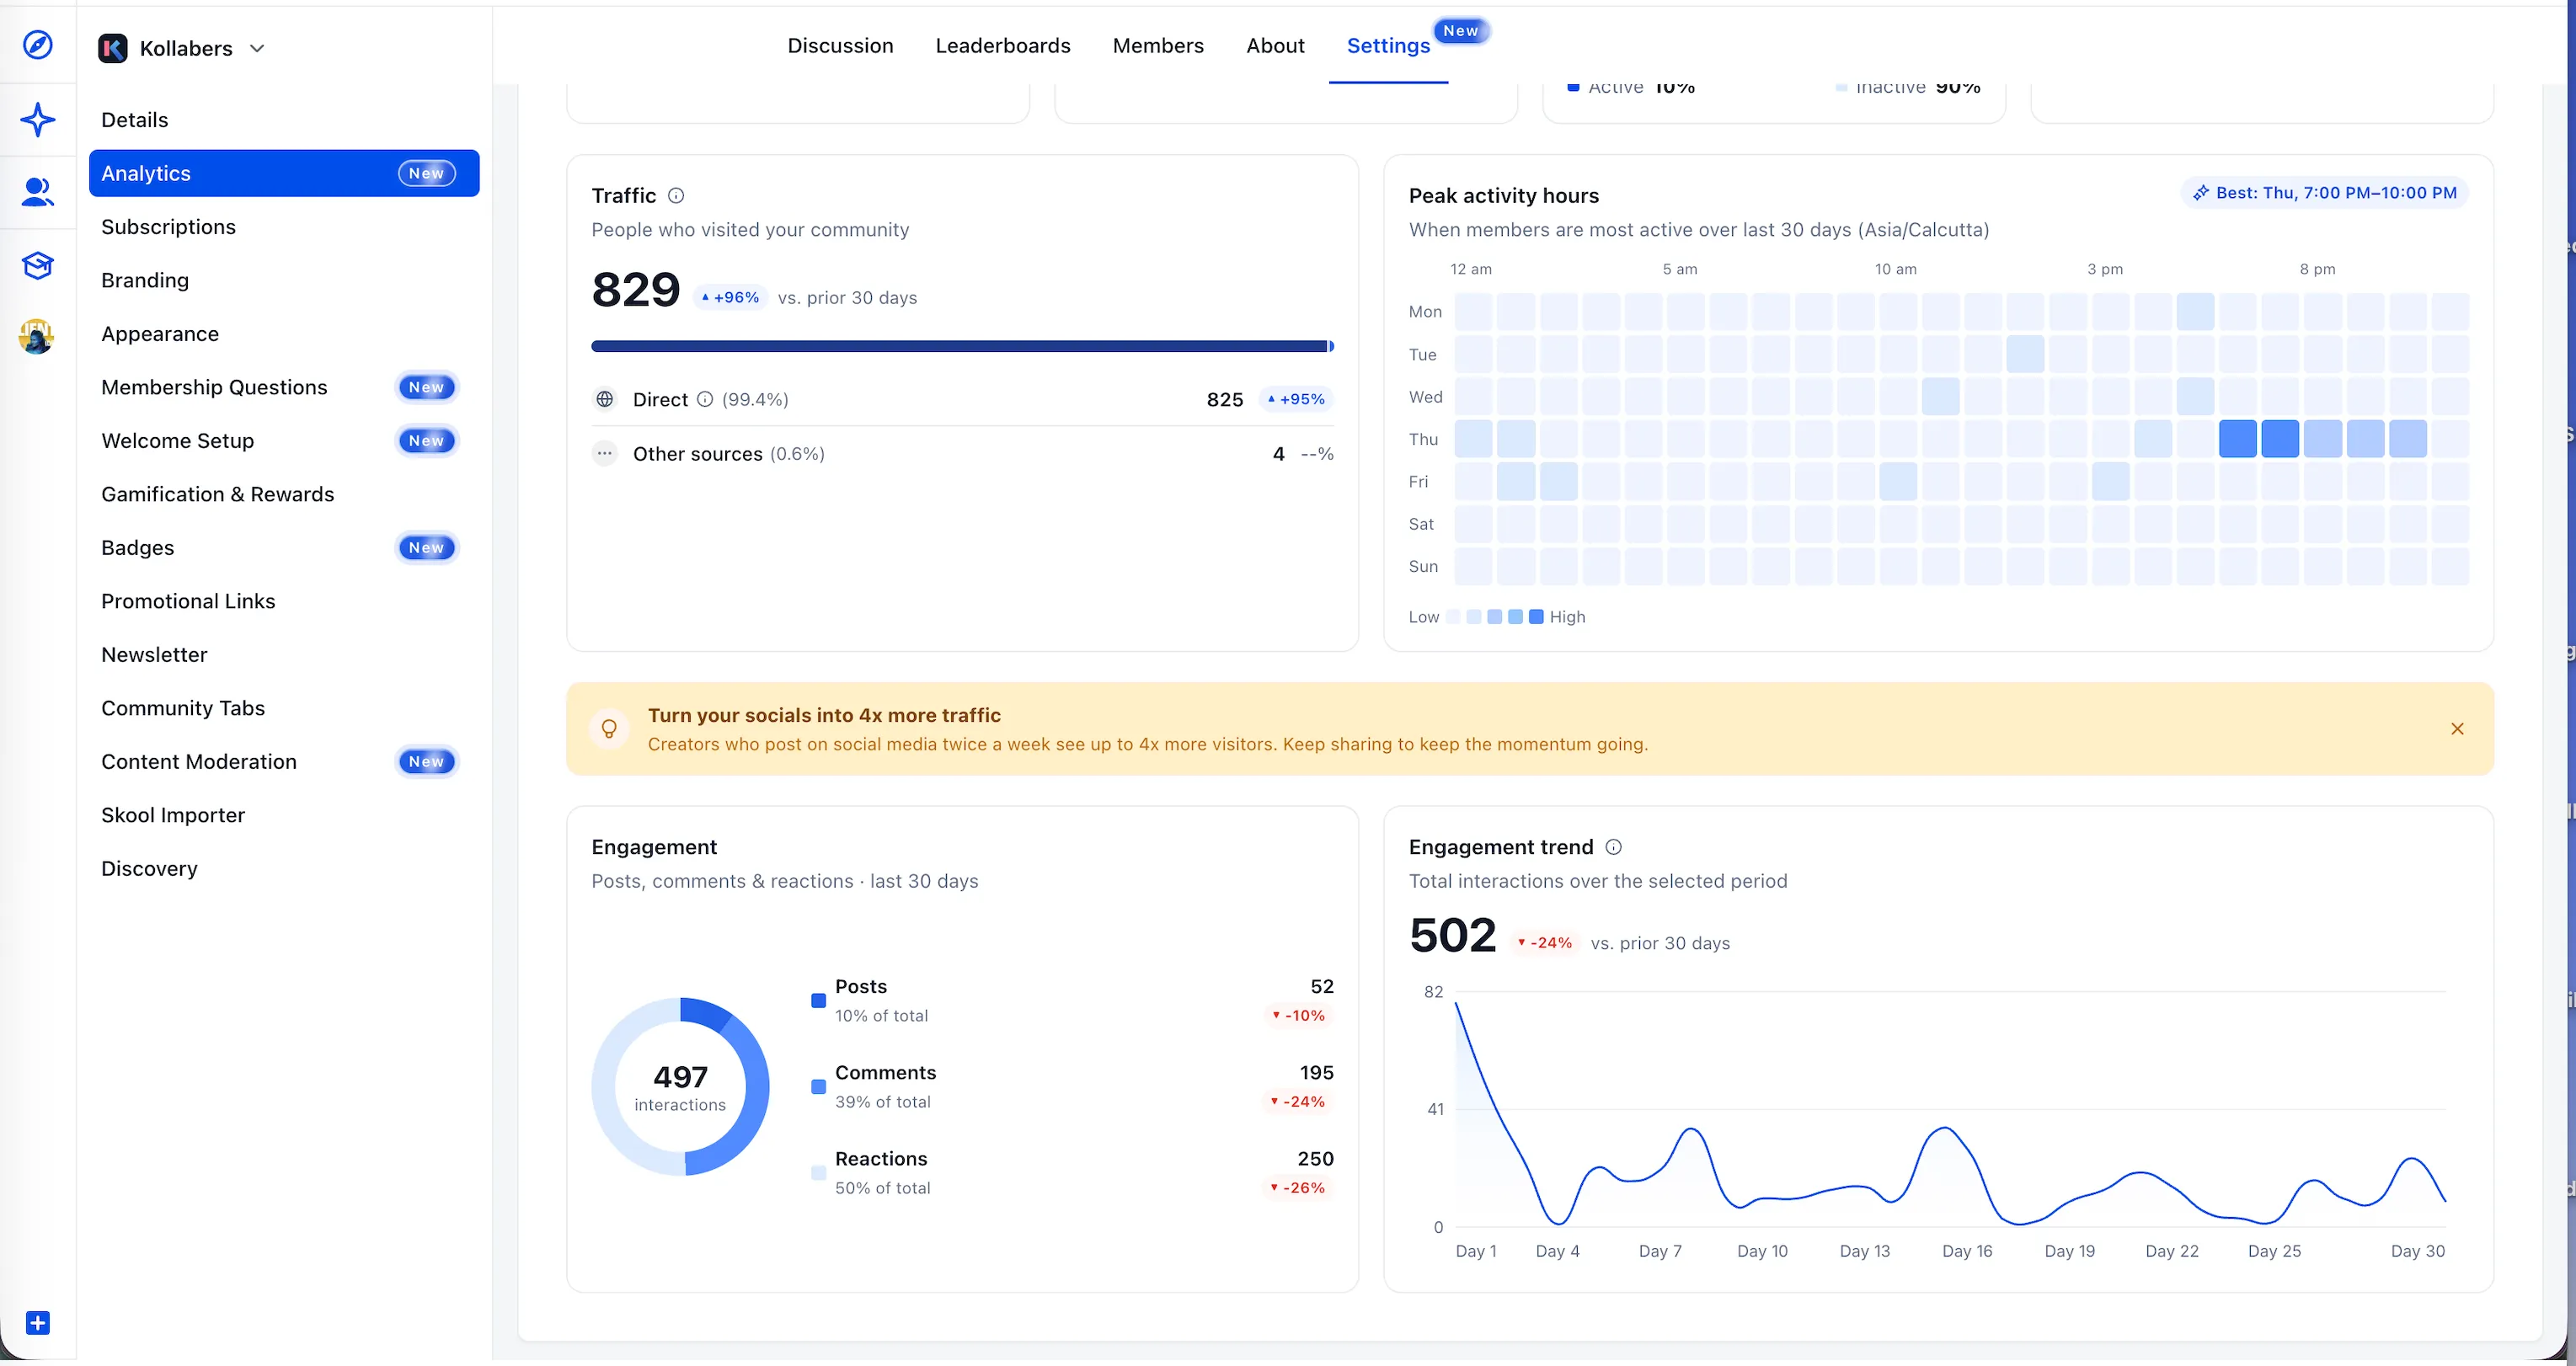
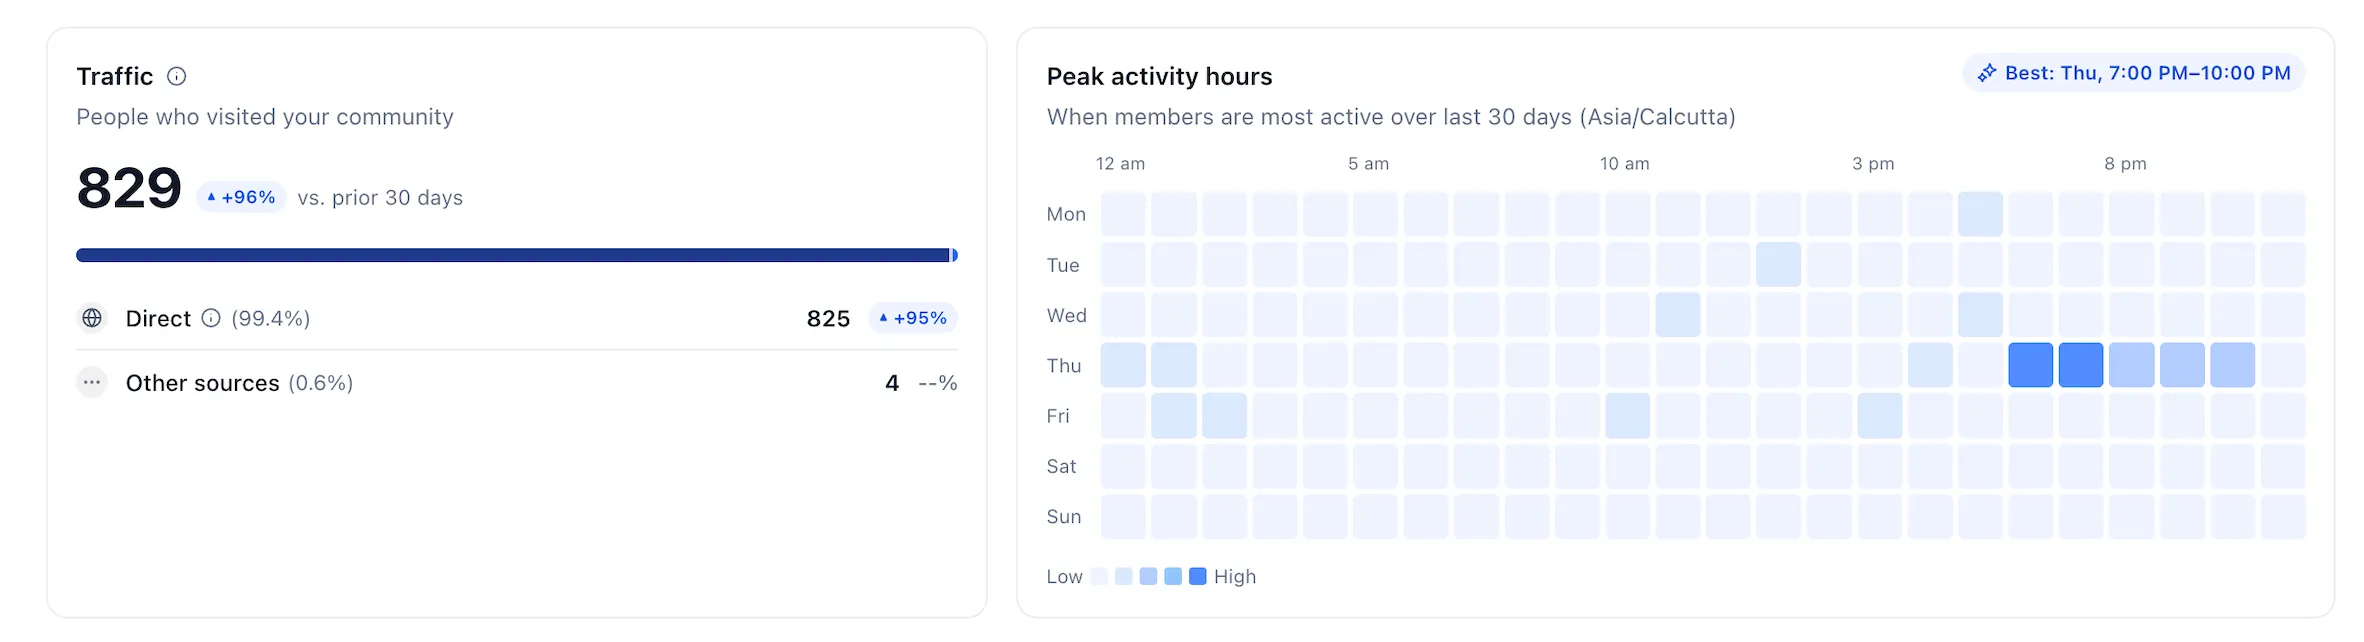
See where community traffic comes from, including Direct, Instagram, YouTube, Facebook, LinkedIn, and Other. Up to four named sources appear by volume, with the rest grouped under Other. Each row includes its own period comparison.
Traffic page-view capture is rolling out. Counts accumulate as visits are recorded; historical traffic is not backfilled. Unique visitors are counted by user ID, falling back to a hashed IP fingerprint. Bots and crawlers are excluded.
Peak Activity Hours
A day-by-hour heatmap shows member activity in the community’s timezone. Darker blocks indicate more activity, and the busiest time slot is highlighted to help you schedule posts, events, and live sessions.
Engagement
A donut chart breaks down posts, comments, and reactions by count and percentage. Engagement totals also include poll votes and event RSVPs. An accompanying trend chart shows total interactions over the selected period and the percentage change from the prior period.
How to Access the Dashboard
- Open Settings in your community.
- Select Analytics in the left sidebar.
- Choose a date range at the top.
- Review performance across the dashboard.
- Use Export on the Inactive Members card to download a CSV for outreach.
Release Images
Need Help Applying This Update?
Want help turning this update into a working part of your CRM, marketing, or automation setup?
Get Started or schedule a demo and we’ll help you map the right next step.