Social Planner Statistics Add Custom Date Ranges and Comparison Views
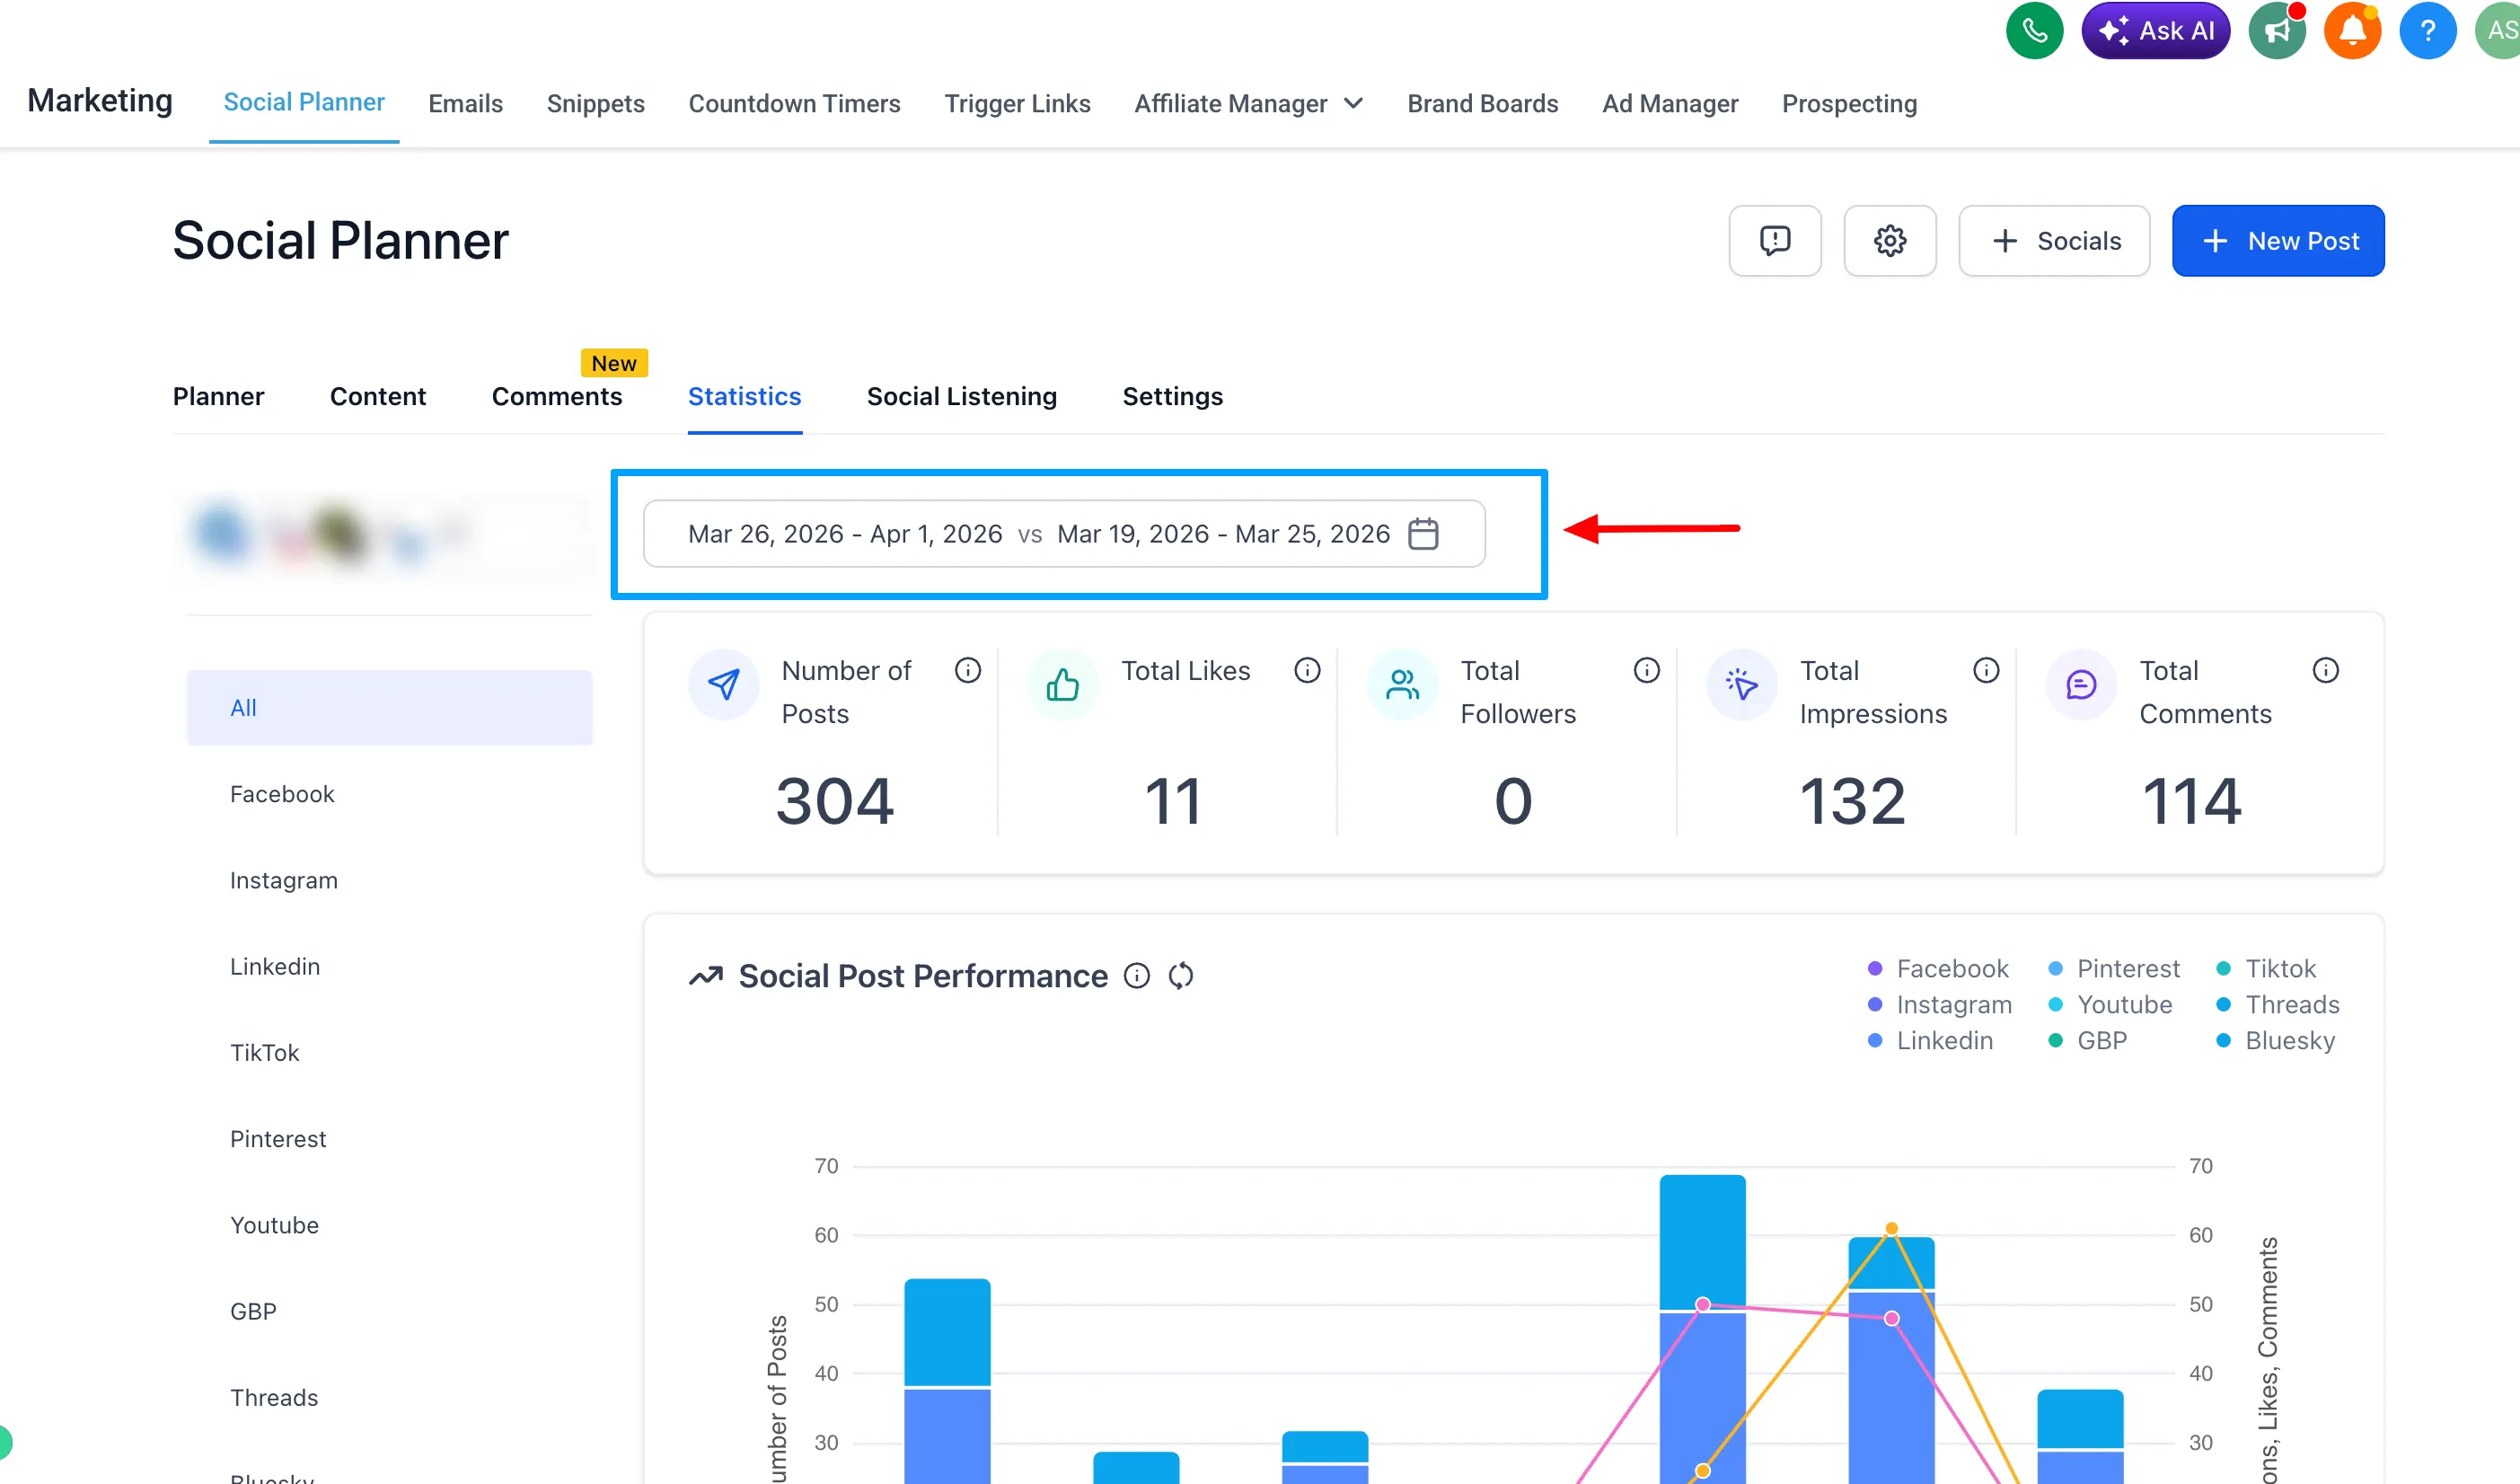
Social Planner statistics now support custom date ranges and comparison views, making it easier to review campaign performance across the timeframes that matter most.
This update replaces the earlier fixed 7-day analytics view with more flexible reporting options for trends, campaign analysis, and growth tracking.
What Changed
Users can now select a custom start and end date in Social Planner statistics.
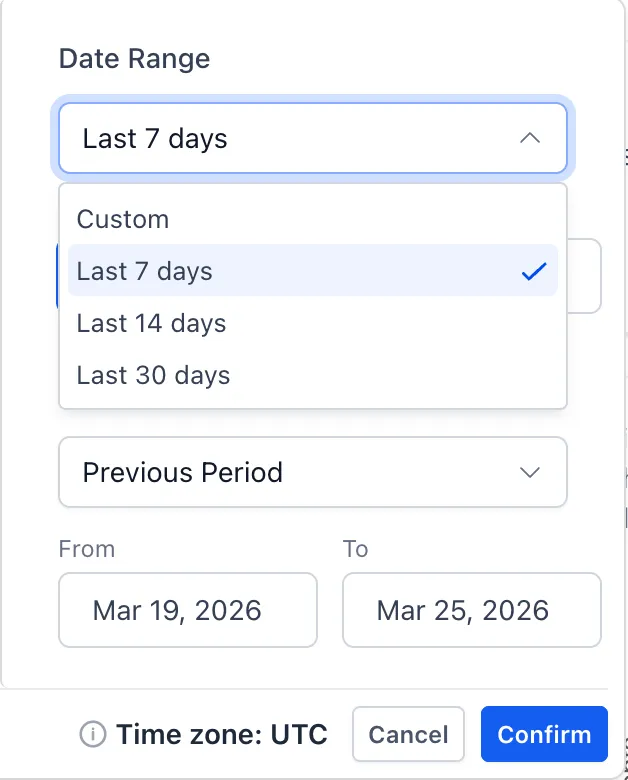
Quick presets are also available for:
- 7 days
- 14 days
- 30 days
- Custom
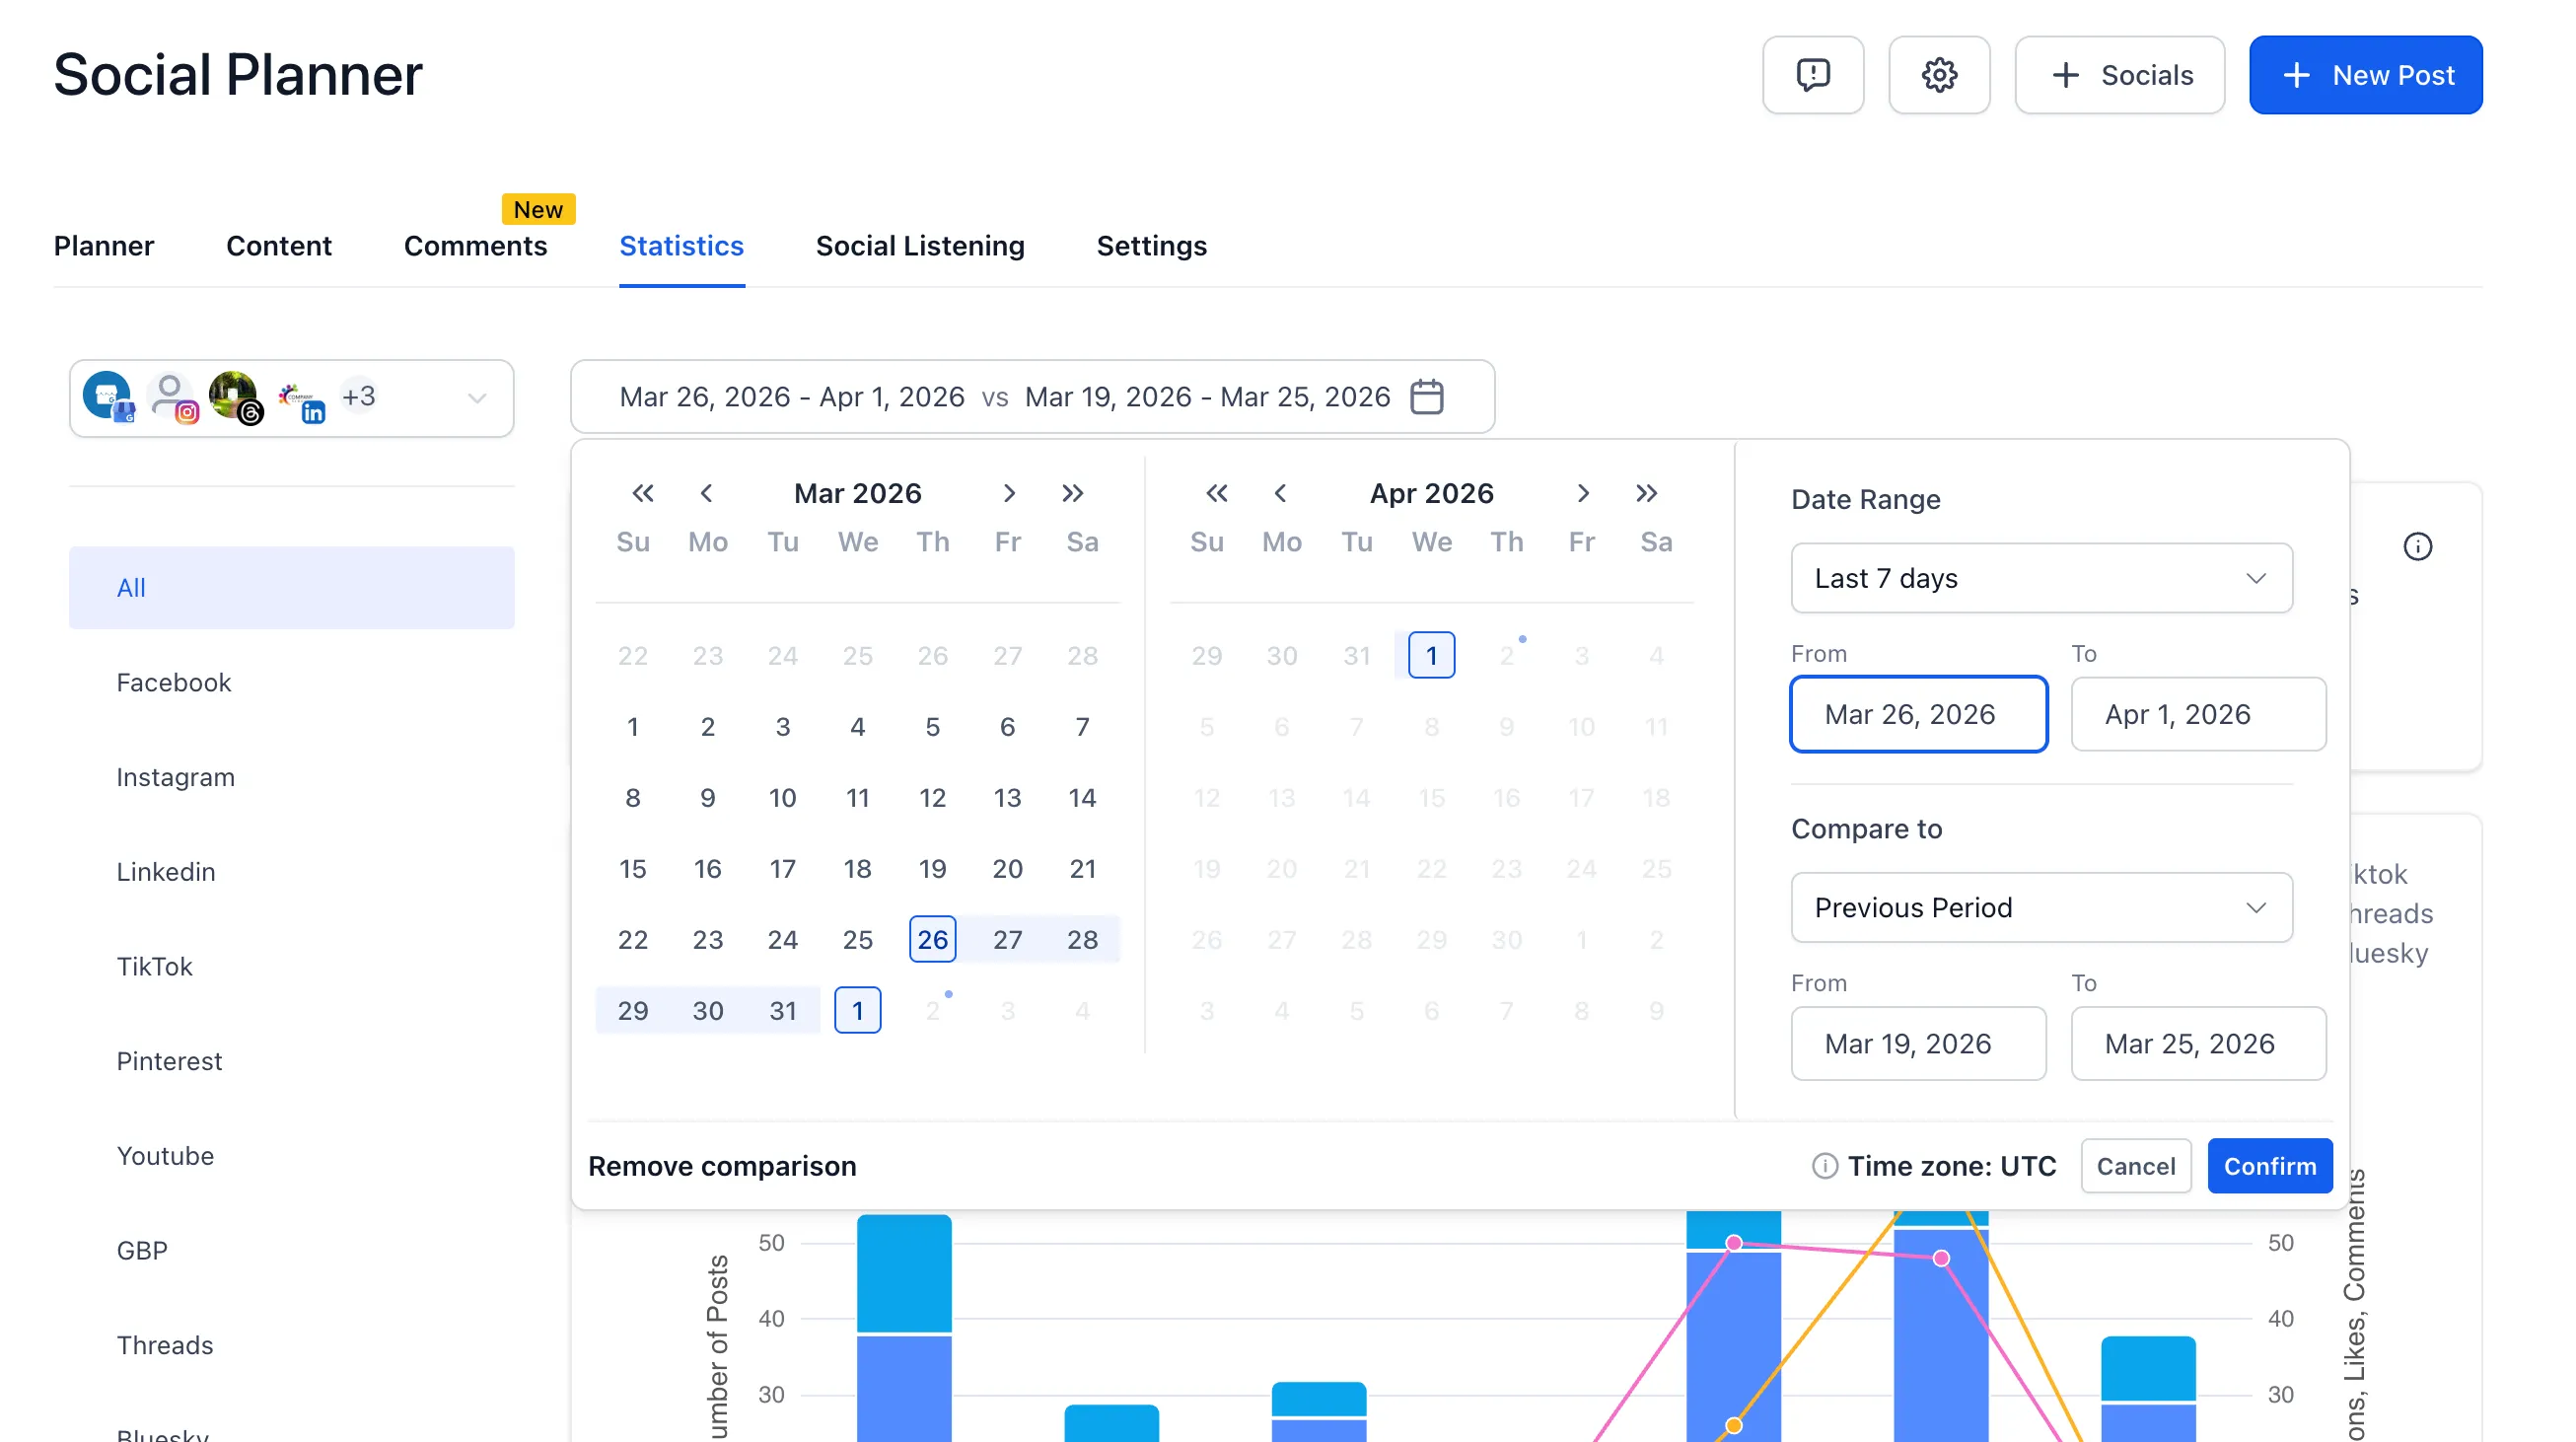
When a date range is selected, KPIs, totals, and charts update based on that timeframe.
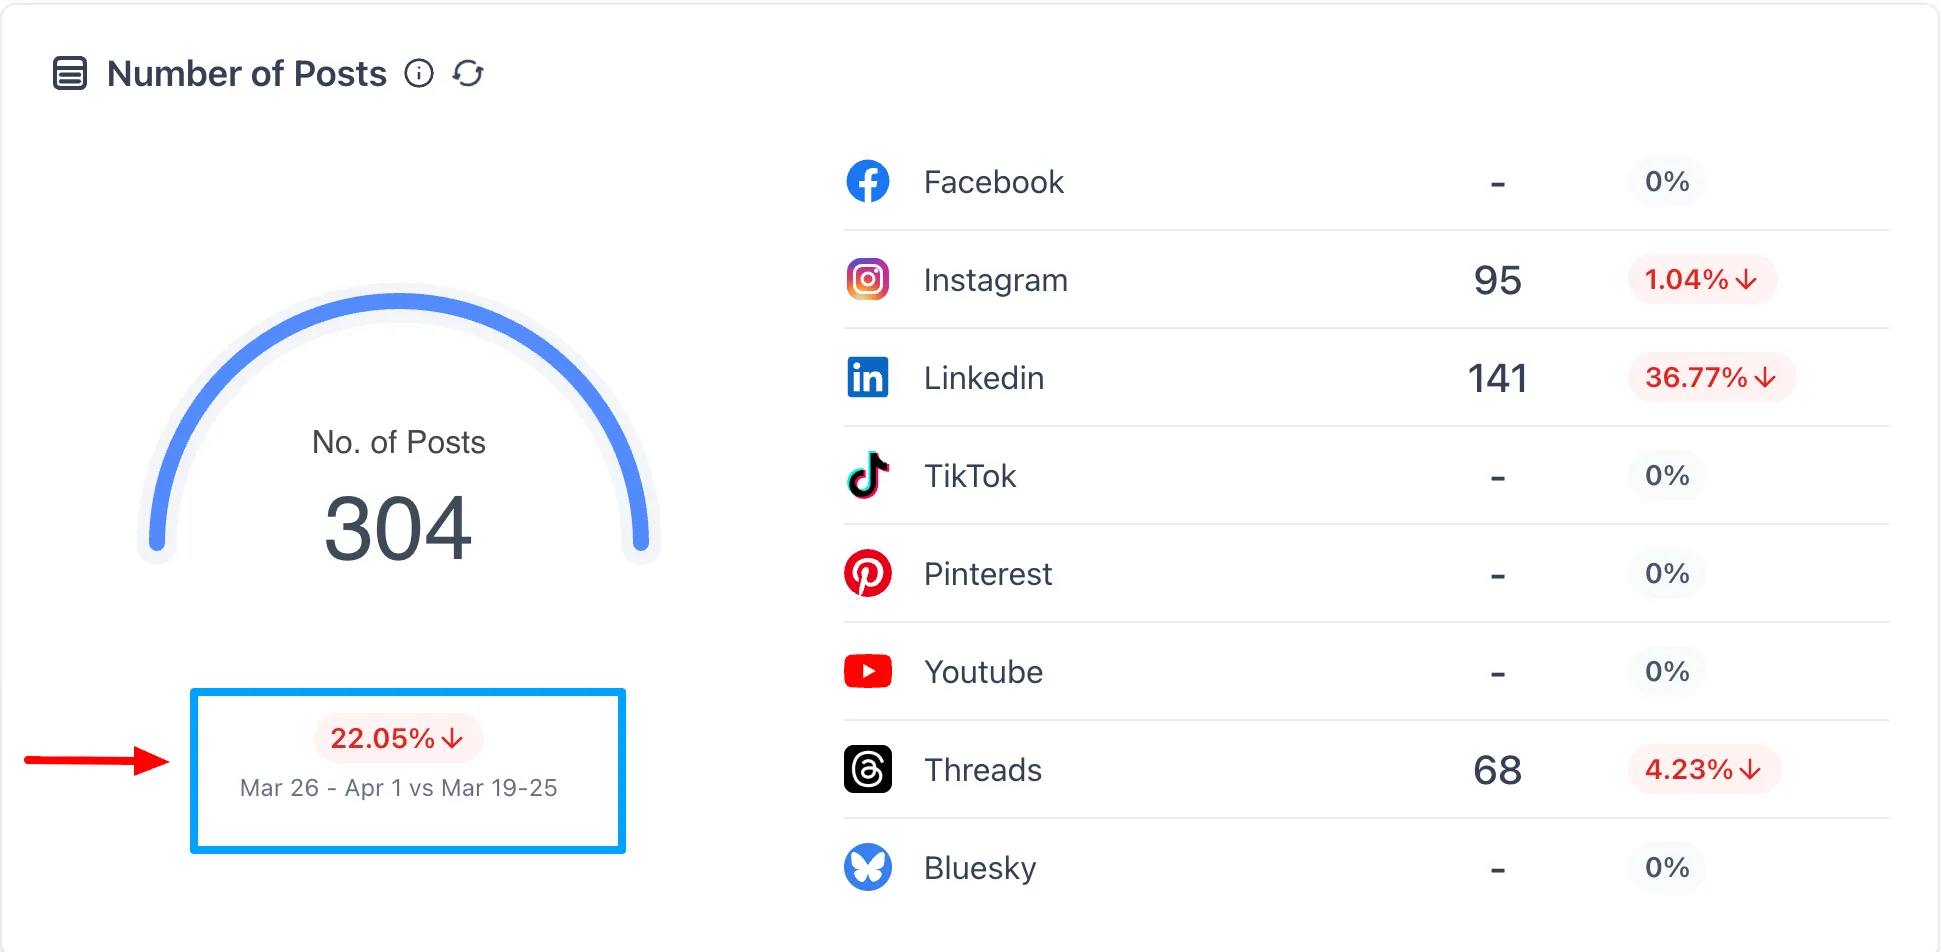
Compare Performance With a Previous Period
Social Planner statistics can also compare the selected date range against a previous equivalent period.
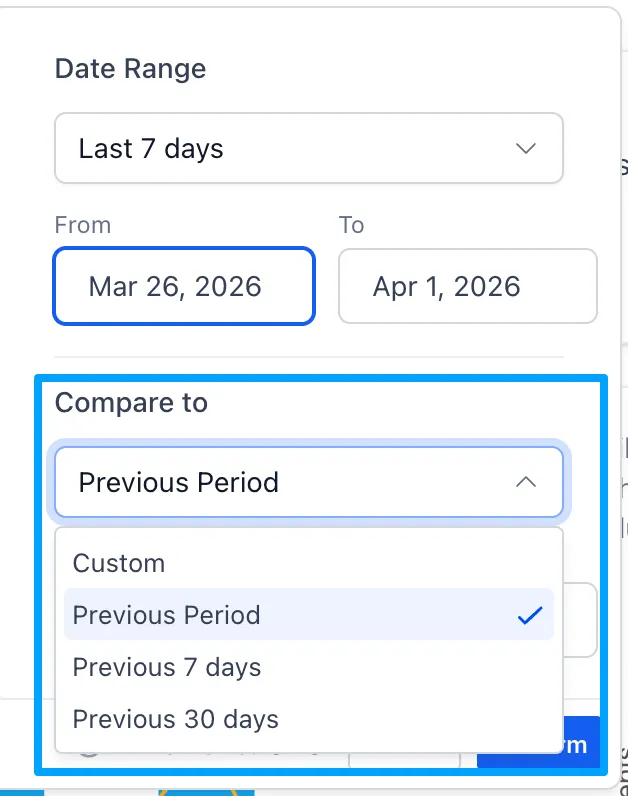
Available comparison presets include:
- Previous Period
- Previous 7 days
- Previous 30 days
- Custom
Percentage change indicators are shown for:
- Total Posts
- Likes
- Followers
- Impressions
- Comments
Improved Chart Scaling
Charts now adjust based on the selected timeframe for easier reading.
- Shorter ranges show daily data points
- Longer ranges use aggregated views automatically
Why It Matters
This update makes it easier to:
- analyze performance across exact campaign windows
- compare growth trends without exporting data
- create clearer reports from Social Planner statistics
- reduce reliance on outside analytics tools
In Case You Missed It
You can also read about TikTok Comments Are Now Supported in Social Planner.
Need Help Applying This Update?
If you’d like help rolling this out in SMBcrm, visit Support or request a demo.